By Jay
For background, I have been targeted with DEW for the last four years. My body has steadily worn down until I began using electromagnetic shielding, mainly lead rubber products, six months ago. I aim to find the frequency of DEW so the TI community can better understand, in scientific terms, what we are dealing with. I hope this study encourages others to collect solid scientific evidence of this crime, further research this area, and use the frequency findings to better measure and shield against DEW.
I will provide here a TL;DR of this article (which you may also consider a spoiler so skip ahead if you don’t want to see the net takeaways):
- An industrial Radio Frequency (RF) meter reveals that the majority of DEW frequency is between 6 GHZ and 50 GHZ. This is hidden to most ordinary people because EMF meters available to the public typically max out at 6 GHZ so they lack visibility into the bulk of DEW frequency readings.
- Using an industrial RF meter, TI’s can see that the cumulative Microwave frequency they are exposed to through DEW is scientifically abnormal and deviates massively from ordinary levels; in my tests I routinely saw RF peaks of 100–200 mW/m2. This represents orders of magnitude beyond what radiation experts consider ‘normal’ in the home and upto 50x higher than allowable FCC limits. A non-industrial RF meter would have missed ~90% of this value. With industrial meters, definitive scientific proof of EMF abnormalities caused by DEW is more achievable.
- Based on my Faraday Tent test with the industrial RF meter, there is reason to believe a portion of the DEW frequency may be north of 25 GHz (25 to 50 GHz).
In this article I will cover:
- Finding Frequencies: the device I used for measuring DEW
- What is the Dew Frequency?: my test readings
- What is Normal?: what are normal RF readings in a home (and how do they compare to the RF readings I found as a TI suffering from DEW)
- Faraday Tent Test: I dig deeper into the range of DEW frequency by testing the meters inside and outside a Faraday tent
Finding Frequencies
Let me go back to beginning of my pursuit of the DEW frequency. In December 2017, I was hit with a strong microwave auditory attack (similar to the one against US diplomats in Cuba). In response, I purchased a Trified EMF Meterwhich measures Radiofrequency (RF) between 20 MHz — 6 GHz. Microwave-frequency induced noise is caused by the Frey effect; which occurs between 200 MHz to 3 GHz — so the Trifield meter would work well for this — it encompasses that range. The Trifield let me see with my own eyes that when I was hit with this microwave noise, the EMF RF readings jumpedbecause it was capturing the frequency range of this particular EMF attack. My peak RF readings would increase 10–100x when I would hear the microwave induced noise!
While I was able to measure accurately the frequency of the microwave auditory attack, I also wanted to pin down the frequency range of the Directed Energy Weapons (DEW) used against TI’s. DEW wears away at the body. It can be “overt” with a zapping pain or it can be “subtle“ where microwave exposure damages muscle tissue, causing mitochondrial damage, etc. but the subject doesn’t feel pain; he or she does feel the body wear down over time though, however.
Unlike the Microwave Auditory Effect (Frey Effect), there is very little public research or information about DEW frequency range. So I sought to find out myself. As mentioned I’ve been hit with DEW for four years; it’s very clear my body pain and fatigue is caused by external microwave frequency because when I use lead shielding, my body recovers. When I don’t have the shielding, my body deteriorates.
So how could I begin to generate data points that would lead me to DEW frequency? One of the challenges a TI faces in confronting this question is that most RF meters sold to the public ONLY measure upto 6 GHz. The reason is that most common problematic RF frequencies are caused by appliances, wifi, and cellular phones — and these typically max out at 5 GHz. For example, WiFi typically functions at 2.4 and 5 GHz. Cellular 3G is between 800 MHz and 1.9 GHz. Cellular 4G ranges from 700 MHz to 2.9 GHz. These publicly available RF meters are meant for common use- and the most common sources of RF frequency, as you can see, are under 6 GHz. These products are not made for TIs and to measure DEW.
There are industrial RF meters that you can buy with probes that measure frequency beyond 6 GHz. The problem is they are pricey. The Narda NBM 550 can measure upto 60 GHz (from 100 kHz). The only thing? A new device along with the probes you will need can set you back $20,000 to $30,000 — out of the range of most TI’s. Here is a pre-owned device on EBay that costs $9,500.
To solve this impasse, I decided to rent the device from one of the many companies that rent industrial equipment. The total cost to me was ~$850 to rent the device and probes for one month. The device is the Narda NBM 550 and the probe I rented was NARD-EF5091 (300MHz-50GHz E Field (Flat) Probe for NBM Series, 8–614V/m).
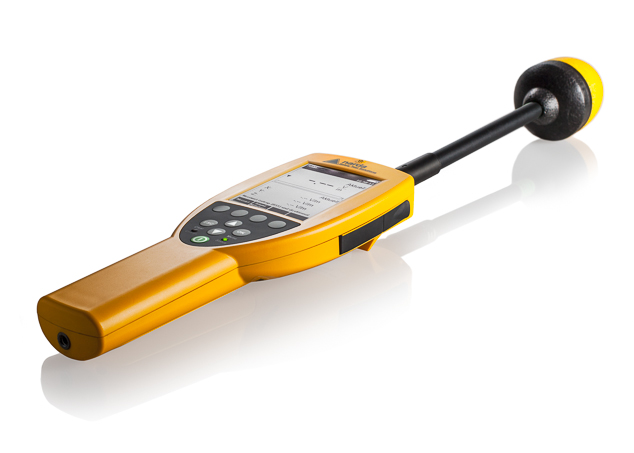
A few days later the package arrived. Device in hand, I began to measure a much wider range of frequency than was possible with typical EMF meters. (During these tests, I turned my Wifi and cellular phone off). So what did I find?
Using an Industrial RF Meter and Initial Findings on What Exactly the DEW Frequency Is
So let’s begin with the findings. The First Key Finding is that it’s very clear that TI’s targeted with DEW are being hit with frequencies above 6 GHz as well; in fact the majority of DEW frequency appears to be north of 6 GHz.
Quick Primer on Frequency Readings: Before I get to the measurements, there are two dimensions to the frequency readings that I want to make clear and distinguish. First is the frequency or frequency range. A frequency range can be: 1 GHz to 6 GHz, for example. The second is the reading — which tells us the volume of frequency we are being exposed to (“how much”). The reading for RF is often measured in mW/m2. This refers to milliwatts by square meter. For the reader’s purpose, just think of the reading as lower is less and higher is more (more frequency exposure). So the Trifield meter’s frequency range is 20 MHz to 6 GHz. And when I use that meter, I will see a reading on its display, saying for example 1.5 mW/m2. What the Trifield is doing is looking at the volume of frequency everywhere between 20 MHz and 6 GHz, adds them up, and comes to a cumulative reading value (in this case 1.5 mW/m2). There is 1.5 mW/m2 of frequency exposure in the 20 MHz-6 GHz range. Hope that makes sense and makes understanding my writeup easier.
Before I get to the measurements, let me get one technicality out of the way. The Trifield meter measures RF in mW/m2 . The Narda NBM 550 measures RF in W/m2. mW is milliwatts and it represents 1/1000th of a watt. W represents one watt. So when I make comparisons, to keep things simple, I will reflect the values of both as mW/m2 so we can make easier apples-to-apples comparisons (all this requires is multiplying the Narda reading by 1,000).
What I am aiming to gauge is how much DEW frequency falls between 0–6 GHz (which I will refer to in this article as “lower RF frequency range”) and 6–50 GHz (which I will refer to in this article as “higher RF frequency range”).
So here is how I am determining what DEW frequency falls into the higher RF frequency range (6–50 GHz). I am using both my Trifield and Narda meters simultaneously. Trifield measures upto 6 GHz. Narda measures upto 50 GHz. I take the readings from both and then subtract the Trifield meeting from the Narda reading. So:
(Narda reading) minus (Trifield reading) = The Cumulative Reading of Frequency in the Higher RF Frequency Range (6–50 GHz)
The Narda reading will be higher because it includes everything in the Trifield reading PLUS RF frequency readings between 6 GHz and 50 GHz as well.
Let me say here that my readings show EMF levels well above ordinary. In normal environments, the Trifield (0–6 GHz) RF peak reading would be under 0.1 mW/m2. There is also no reason to have significant levels of RF frequency above 6 GHz (6–50 GHz) in a civilian environment such as mine. So I’m making an educated guess most of my RF readings represent ‘excess’ and reflect DEW frequency — as these readings are well above 0.1 mW/m2. (I talk more about “normal” levels in the section below “What is Normal?”)
I should note I’m being hit with DEW constantly and so these readings should reflect the EMF abnormalities generated by such attacks.
So let’s begin with my readings. Here is one reading :
Date: October 30, 2018
Time: 6:21 PM
Trifield peak reading: 1.1 mW/m2
Narda peak reading: 15.6 mW/m2
Higher RF Frequency Range total (6–50 GHz) : 14.5 mW/m2.
So approximately 93% of the DEW EMF is coming from the higher RF frequency range (6–50 GHz).
Here is another reading:
Date: October 30, 2018
Time: 6:41 PM
Trifield peak reading: 1.3 mW/m2
Narda peak reading: 10 mW/m2
Higher RF Frequency Range total (6–50 GHz): 8.7 mW/m2.
Here 87% of the DEW EMF is coming from the higher RF frequency range (6–50 GHz).
The are more readings like this. In repeated readings, I find that the higher RF range (6–50 GHz) makes up 60–95% of the total frequency readings.Based on these repeated readings, I have a high degree of confidence that DEW is likely between 6 and 50 GHz and not in the lower radiofrequency range like Microwave Auditory attacks are (which are typically 1 to 3 GHz). (I should also add here that I have not tested frequency above 50 GHz and there is a possibility that DEW frequency is over 50 GHz as well or primarily).
Second Key Finding: Industrial EMF meters reveal that TI’s are subject to Much Higher Microwave Exposure than One Might Think if using an ordinary EMF meter
During the DEW attacks, I routinely see peak RF readings of 100–200 mW/m2 with the Narda NBM-550, especially in my bedroom where I am targeted most commonly. As I’ll explain in the next section (“What is Normal?”), this is highly abnormal for a residence and I believe this kind of data collection takes TI’s towards concrete, indisputable scientific proof that they are targeted with directed energy. These levels are ~1,000 times higher than what radiation specialists consider problematic.
Two important things here. First, without access to this ~$25,000 device, most TI’s only capture a small percentage of DEW frequency. As mentioned 90% of these readings are in the High RF Frequency range that ordinary EMF meters don’t capture. So it’s possible TI’s went to authorities or courts with radiofrequency readings that seemed abnormal, but not high enough to be indisputably problematic. There is a difference in showing one is subject to 100 mW/m2 RF frequency versus 10 mW/m2.
Industrial meters like Narda capture the fuller picture, and reveal more accurate readings which show TI microwave exposure is 10x higher than previously thought. Now TI’s have more complete, accurate data with which to present their case. If you are a TI with a Trifield meter, or a Cornet meter, etc. and see abnormal readings like occasional peak readings of 1–10 mW/m2 (while controlling for wifi/cellular while testing), your actual exposure may be significantly higher than that– which could explain your symptoms. (See the UCSD/Golomb study for how microwave exposure explains a vast array of physical symptoms)
Second, there is less noise-to-signal to this industrial EMF reading number. Since 90% of frequency falls into the High RF Frequency Range (6–50 GHz), there is far less ambiguity or reason to doubt these abnormally high levels. That’s because in that high range, Wifi and cellular cannot be used as a reason by critics to suggest the reading is inflated due to ordinary household electronic communications. This is because those electronics do NOT operate in the High RF Frequency range. There is clearly some unusual cause of these high readings TI’s are finding and now it cannot be argued away by claiming ordinary household electronics are that cause. (even though TI’s turn off Wifi and cellular when doing these tests, critics can still claim that’s a cause; or claim nearby use of cellular and wifi is a cause). Even if those ordinary electronics contribute to the reading, they only impact that 10% ‘Low RF Frequency range”; the 0–6 GHz component of the overall number.
One of the reasons I rented the Narda device was to test my suspicion that DEW frequency went above the ranges that typical EMF RF meters cover. This encourages me to invest in a Spectrum Analyzer or Selective Radiation Meter to gauge the problematic DEW frequency or frequency range more precisely. But before I invested in that, I wanted to first use an industrial RF meter to first see what range of GHz frequency I would need the spectrum analyzer to cover. It’s clear now that I should get an analyzer that reaches up to 50 GHz if not higher.
What is Normal?
Patrick van der Burght (an authority on radiation assessment in homes, mitigation and radiation-free building support; and an international speaker on radiation measurement) describes here that a 0.01 mW/m2 RF reading as ideal in the home and a 0.3 mW/m2 reading as potentially problematic likely requiring shielding. Now let’s come back to my findings of 100–200 mW/m2 of radio frequency exposure . Granted this was over a larger frequency range, but given that there are no common causes of high-frequency in homes (over 6 GHz), that is a worrisome level — and certainly abnormal & suspicious. This suggest a reading ~600x higher than a problematic level of radio frequency, as determined by an expert in the field.
The FCC puts out guidelines on maximum exposure of frequency (“Limits for Maximum Permissible Exposure (MPE) — from §1.1310”). According to their guidelines, the maximum exposure for frequencies between 1.5 GHz and 100 GHz is 5 mW/m2. As mentioned above, I often see Narda readings of 100–200 mW/m2 in this range (6 GHz-50 GHz). So this appears to be 2x to 40x higher than the FCC limit. When TI’s are hit with DEW, the amount of frequency they are exposed to, and can measure objectively and scientifically, clearly exceeds ordinary limits from ordinary household electronics and is in a range the government deems unhealthy.
One note: The FCC puts out other numbers for frequency levels below 1.5 GHz. These levels are conservatively high, ridiculously so, and are meant to protect against EXTREME overheating and electric shock. The reality is that health is impacted well under these levels. From SmartGrid Awareness:
“Bioeffects and adverse health impacts that have been measured “at very low [microwave] levels” based upon published studies from various emission sources…Various governmental RF exposure guidelines that do not fully protect public health. In particular, the guidelines for the USA and Canada were only established to protect tissues from significant overheating and electric shock.”
More Testing — Using a Faraday Tent
Recently, I purchased a Faraday tent from Holland Shielding.
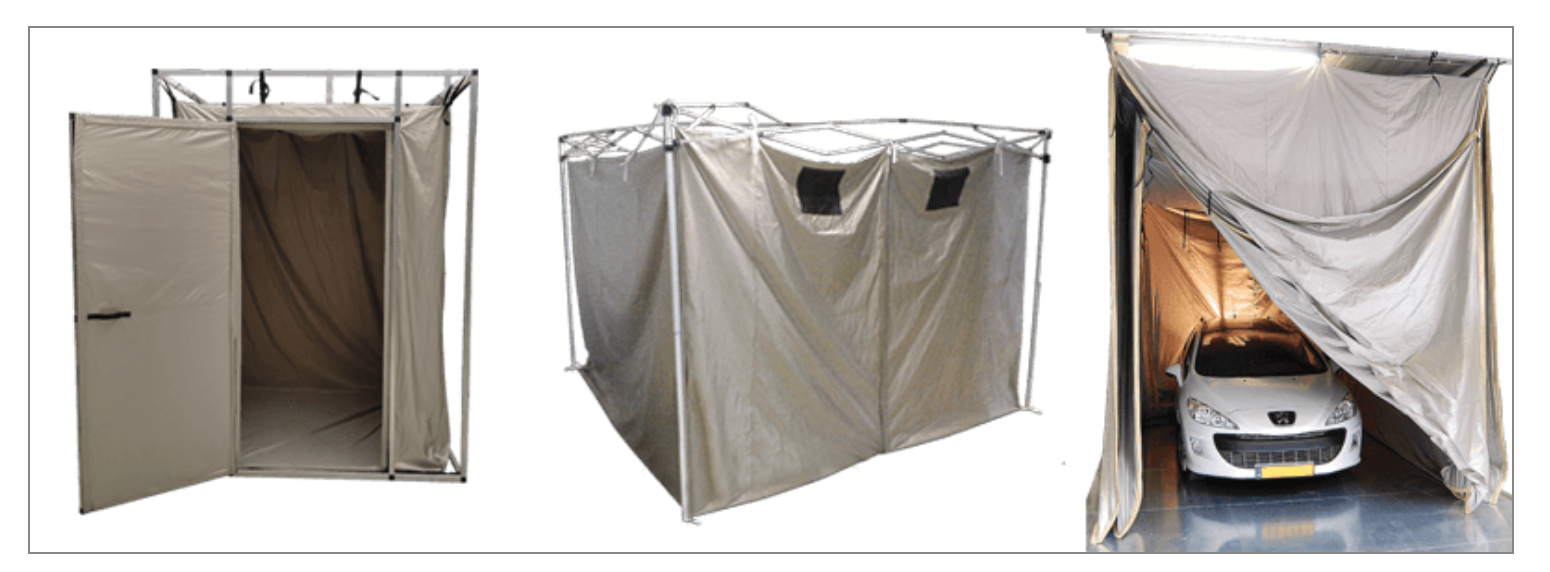
This Faraday tent helps for many TI symptoms (artificial headaches, energetic disturbance to keep from sleeping, sleep disruption) but I’ve noticed that I need to continue wearing my heavy-duty lead shielding to ward off DEW attacks while in my tent. Without it, I wake up sore — tent or no tent. What I gleaned from this was that DEW frequency is likely higher frequency than what my tent can shield for.
So let’s look at the shielding chart for Holland Faraday tent.

So your first thought might be: ‘What exactly does this chart show?’ First thing- I purchased the “Double layer” Holland tent which is reflected in the black line above. The chart shows the shielding performance of the tent at different frequencies (shown at the bottom axis). As the frequency strength increases, the tent shielding performance declines. The vertical axis refers to dB or decibels. What is dB/decibels and what does it have to do with EMF shielding? Good question. It turns out that although we are used to hearing decibels in terms of sound, it actually refers to a change in intensity. According to LessEMF:
“ [Decibels] are a way to describe the ratio of one intensity measurement to another. Expressing it this way is a useful for engineers to make comparisons. Using decibels we can compare the field intensity before and after an event, or compare a measured intensity to a known reference. We can use it to compare electric fields, magnetic fields or even radiofrequency intensity.”
LessEMF has a good explanation of this if you’d like to read more. Here’s one useful comparison chart to compare Decibels to the % shielded:
So we can see that if we’re dealing with less than 20 dB of shielding, we are blocking less than 99% of EMF at that frequency.
Coming back to the Holland Tent’s Shielding Properties
If we come back to the Holland shielded chart:
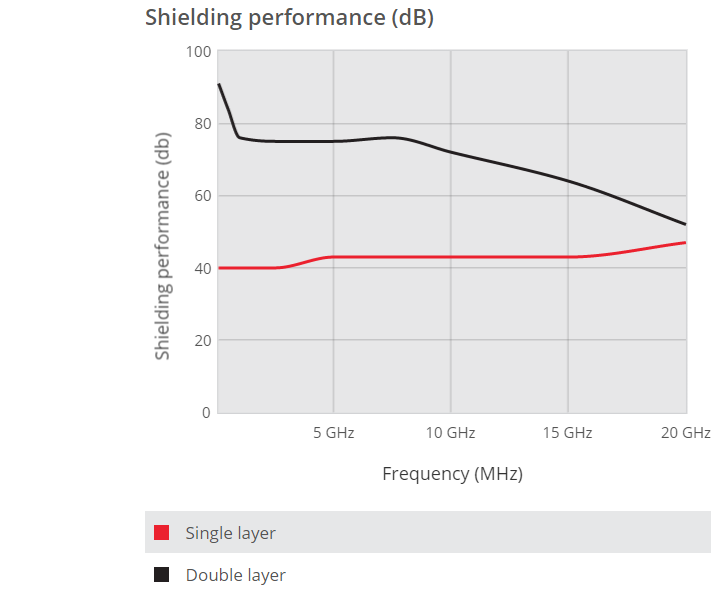
we see that by 20 GHz, we are down to ~50 dB which is sufficient to block well more than 99% of frequency at that level. However, the shielding strength declines precipitously 10 GHz and beyond/above. I must admit I do not have the Holland tent shielding details beyond 20 GHz (I have requested those from them but they do not have such information). For purposes of estimation, if I assume the rate of decline in dB protection continues at the same pace between 20 and 50 GHz as it does between 10 and 20 GHz, then we would see the following dB protection:
At 30 GHz: 30 dB
At 40 GHz: 10 dB
Per the LessEMF chart,
, when we are at 10 dB of protection, the tent is letting through a fair amount of radiation at that level (40 GHz). The protection is likely poor at 40 GHz and worse at 50 GHz — which is where the DEW frequency may well be.
Admittedly, this is a rough analysis; anyhow we see that the tent’s ability to shield frequency declines as the frequency increases and if in fact DEW exists at very high frequencies (40 GHZ, 50 GHZ) it would explain how it gets through the tent’s defenses. This matches my experience and symptoms. While the Holland Faraday tent adequately prevented various TI symptoms such as sleep issues, I continued to have DEW symptoms of sore/tight muscles. Knowing the Holland tent shielded almost completely upto 20 GHz, I theorized that at least some portion of DEW frequency must be higher than 20 GHz for me to be in the tent but still be impacted by DEW frequencies.
Interestingly enough, the testing with the Trifield and Narda meters validates this theory.
The Faraday Tent Measurement Data
The Trifield meter (measuring 0–6 GHz) readings within the tent went to 0 (with an occasional max peak 0.006 mw/m2 — an almost insignificant number). However, the Narda meter (0–50 GHz) had much higher readings, showed peaks of nearly 20 mW/m2. This shows that low to moderate microwave frequencies were blocked by the tent (0–6 GHz) but higher frequencies (6-50 GHz) were not; or at least not completely. Some of the latter were getting through and not in insignificant numbers. The fact that I had DEW symptoms in the tent (but not other TI symptoms typically associated with lower frequencies like sleep disruption, microwave noise, etc.) is explained by this measurement data and indicates that DEW is not only north of 6 GHz, but likely north of 30–40 GHz as well (because the tent sufficient blocks up to those levels of frequencies).
In my bedroom, outside the tent, the Narda meter repeatedly peaked at 0.2 W/m2 which is 200 mW/m2. This is very high (recall the radiation expert Van der Burght described 0.3 mW/m2 as problematic) . The high readings in the bedroom are consistent with the concept of “designated targeted areas” — areas where the subject is microwave targeted in a concentrated way. These are often fixed definition spaces that the subject spends considerable time, ideally immobile. Immobility is desirable because as indicated in the UCSD/Golomb study, the device projecting frequencies must be re-positioned to reach the subject if there is movement — as happened to US diplomats in Cuba ; theoretically, this requires more supervision and is less effective overall. Also per the study, diplomats found their bedrooms were ‘designated targeted areas’ where targeting was extreme; sometimes the targeted area was even narrower- such as just their bed. What I am referring to as ‘designated targeted areas’ the UCSD study describes as: “Laserlike localization of sounds”. From the study,
There was apparent “laserlike” localization of [microwave-generated] sounds in some cases. For diplomats, “…at least some of the incidents were confined to specific rooms or even parts of rooms with laser-like specificity…. One incident was described in media as follows: “The blaring, grinding noise jolted the U.S. diplomat from his bed in a Havana hotel. He moved just a few feet, and there was silence. He climbed back into bed. Inexplicably, the agonizing sound hit him again. It was as if he’d walked through some invisible wall cutting straight through his room. Soon came the hearing loss and speech problems…” The physics of EMR is, to the contrary, compatible: lasers are themselves focused EMR. Tautologically, EMR can be focused in “laser-like” fashion.
So to recap, I see peaks of 200 mW/m2 RF in my bedroom outside my tentand 20 mW/m2 inside of it. So while my tent blocks much of the frequency (as much as 90%), it permits some percentage through (10%) — and I suspect this is at higher frequency ranges (ie: 40–50 GHz) where the Faraday tent does not shield ideally. While one may consider 90% shielding effective, when what is allowed through generates 20 mW/m2 of frequency- this is 60x beyond what is considered problematic microwave frequency exposure.
Finally, since I do not have the exact shielding numbers for the tent beyond 20 GHz, I am hesitant to draw absolute conclusions, but the fact that there appears to be microwave exposure during DEW of below ~30 GHZ which is blocked AND frequency above 30 GHz that gets through (partially), this seems to indicate that DEW may not be a single frequency but TI’s are subjected to a range of frequencies between 1–50 GHz. We know from my testing above that much of that frequency is above 6 GHz and know from the tent testing that some percentage is likely 30–40 GHz and above.
In Conclusion
Industrial EMF meters let us see what ordinary EMF meters cannot. We see a more accurate level of microwave frequency TI’s who suffer from DEW are exposed to (which may be 10x higher than what they gauged with consumer EMF meters). Further we are able to gauge that a large portion of DEW EMF (60–90%) is above 6 GHZ (6–50 GHz). The Faraday tent test I conducted suggests some portion of DEW frequency may be 40 GHZ and above.
Conducting this testing was not easy. It was expensive. There were disruptions and malfunctions, some of which were inexplicable. My targeting also increased significantly during this period. However, my research has led to some findings that the TI community will find useful — and more importantly can build upon. I hope the data is useful for:
- Moving the community forward scientifically in terms of nailing down the elusive DEW frequency that is being used against us maliciously. I hope these findings guide other TI researchers to further analyze DEW frequencies and the magnitude/power at various frequencies.
- Empower TI’s with a scientific study that shows if they are experiencing DEW, the RF exposure they have is likely several multiples of what consumer EMF meters show.
- Encouraging TI’s to collect scientific data (frequency readings) with EMF meters of their DEW (and other) targeting.
- Knowing the DEW frequency or frequency range will allow us to better shield adequately.
For my part, I will continue to research, likely moving on to spectrum analyzers and the like to better understand the most problematic frequency ranges of DEW.
The End
Notes
- Using Peak Readings: My method of measurement was to evaluate the Peak reading for both meters. The reason is that there is reason to believe DEW functions through pulsed microwave radiation. In the case of pulsed microwave radiation, impact is best measured not through averages but that of a single pulse. From the Golomb study (page 7), “Of note, Frey induction is not governed by average radiation intensity, but the energy in a single pulse. (Analogously, if a jackhammer hit each 2 minutes, the low time-averaged pressure would not explain the damage.)”. Though the Frey effect and DEW differ, they both function on pulsed microwave radiation and so I applied this same methodology.
- Correlation: While the Narda and Trifield meters varied in readings (as they covered different frequency ranges), did they at least move directionally in sync? That is, when one increased, did the other increase as well? I found this was often the case (leading one to believe that DEW sufferers could use an RF meter w/a limited frequency range and still directionally gauge when DEW exposure increased) but not always the case. For example, in one reading, I have the Trifield at 0.8 mW/m2 and the overall Narda reading at 1 mW/m2. This was a rare reading where the low frequency range (under 6 GHz) made up a large portion of overall microwave frequency: 80% (instead of closer to 10% in much of my testing). So there are times when one meter will surge and the other will not.
Link to Jay’s work on EMF: https://medium.com/@Jay_Coins